Member Services Desk
Weekly Market Update
This MSD Weekly Market Update reflects information for the week ending March 1, 2024.
Economist Views
Click to expand the below image.
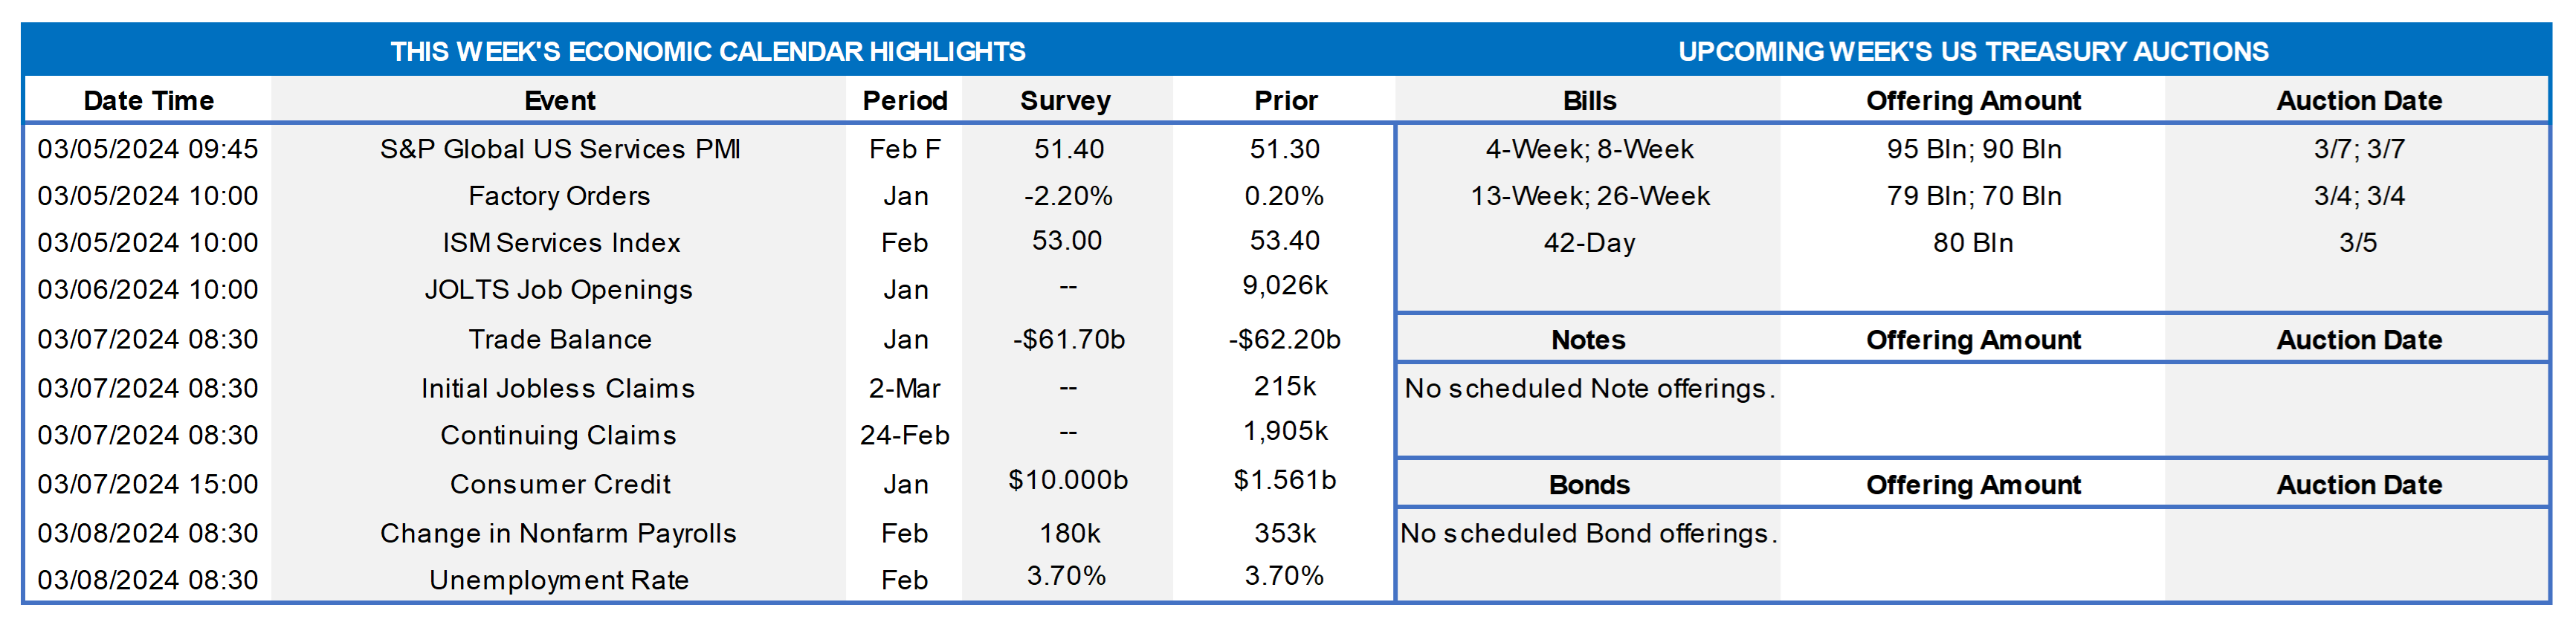
The Federal Open Market Committee (FOMC) meeting will be the marquee event of the upcoming week. Policymakers are almost universally expected to leave the federal funds rate target range unaltered at 5¼% to 5½%. The post-meeting communiqué likely will reiterate that economic activity has been expanding at a solid pace and that, while job gains have moderated from early last year, they remain strong, and the unemployment rate is low. The policy statement can be expected to repeat that, while the FOMC believes that the risks to achieving its employment and inflation goals are moving into better balance, the economic outlook is uncertain and committee members are highly attentive to inflation risks. The upcoming communiqué probably will again omit any forward guidance on the likely direction of administered rates yet also note that policymakers would be prepared to adjust monetary policy if risks emerge to the attainment of their goals. Most important, the statement probably will repeat that the FOMC does not expect it will be appropriate to reduce the target range until it has gained greater confidence that inflation is moving sustainably toward 2 percent. The FOMC will continue its portfolio runoff of maturing Treasurys and agency debt and agency mortgage-backed securities.
The Federal Reserve Board will also release an updated Summary of Economic Projections, or SEP. The so-called “dot plot” of policymakers’ expectations for the federal funds rate target through 2026 will receive considerable attention from traders and investors. Meeting participants will also update their forecasts for real GDP growth, the unemployment rate, and key inflation measures.
NAHB Housing Market Index: Rosier appraisals of current and prospective sales, combined with an improvement in prospective buyer traffic, probably pushed the National Association of Home Builders’ confidence gauge back to the neutral 50-point mark from 48 in February.
Housing Starts & Building Permits: While the Street expects both housing starts and the number of building permits issued to rebound to respective SAARs of 1.425mn and 1.5mn in February, a dramatic improvement in weather conditions from those prevailing in January suggests that both of those forecasts likely will prove way too low.
Jobless Claims: Initial claims for unemployment insurance benefits probably remained rangebound between 200-220K during the filing period ended March 16. Continuing claims – the total number of persons collecting benefits – likely clocked in below the 1.9mn mark during the week ended March 9 – a sign that the recently unemployed are having little problem finding work.
Index of Leading Economic Indicators: The Conference Board’s augur of prospective economic activity is expected to have fallen by .3% in February. While that result would mark the 23rd straight decline in the LEI, the economy has shown few signs of faltering. Indeed, the Federal Reserve Bank of St. Louis’ smoothed recession probabilities model placed the probability that the economy was contracting in January at a negligible .3%.
Existing Home Sales: A reversal in home-purchase contract signings in January suggests that closings nationwide dipped by .7% to a SAAR of 3.97mn in February. With the number of available homes on the market likely to contract by 1% to 1mn on a not seasonally adjusted basis during the reference period, the supply at the estimated sales pace would hold steady at three months.
Federal Reserve Appearances:
- Mar. 19 Federal Open Market Committee (FOMC) meeting begins.
- Mar. 20 FOMC policy statement and updated Summary of Economic Projections to be released.
- Mar. 20 Fed Chair Powell to hold post FOMC-meeting press conference.
- Mar. 22 Atlanta Fed President Bostic to participate at the 2024 Household Finance Conference in Atlanta.
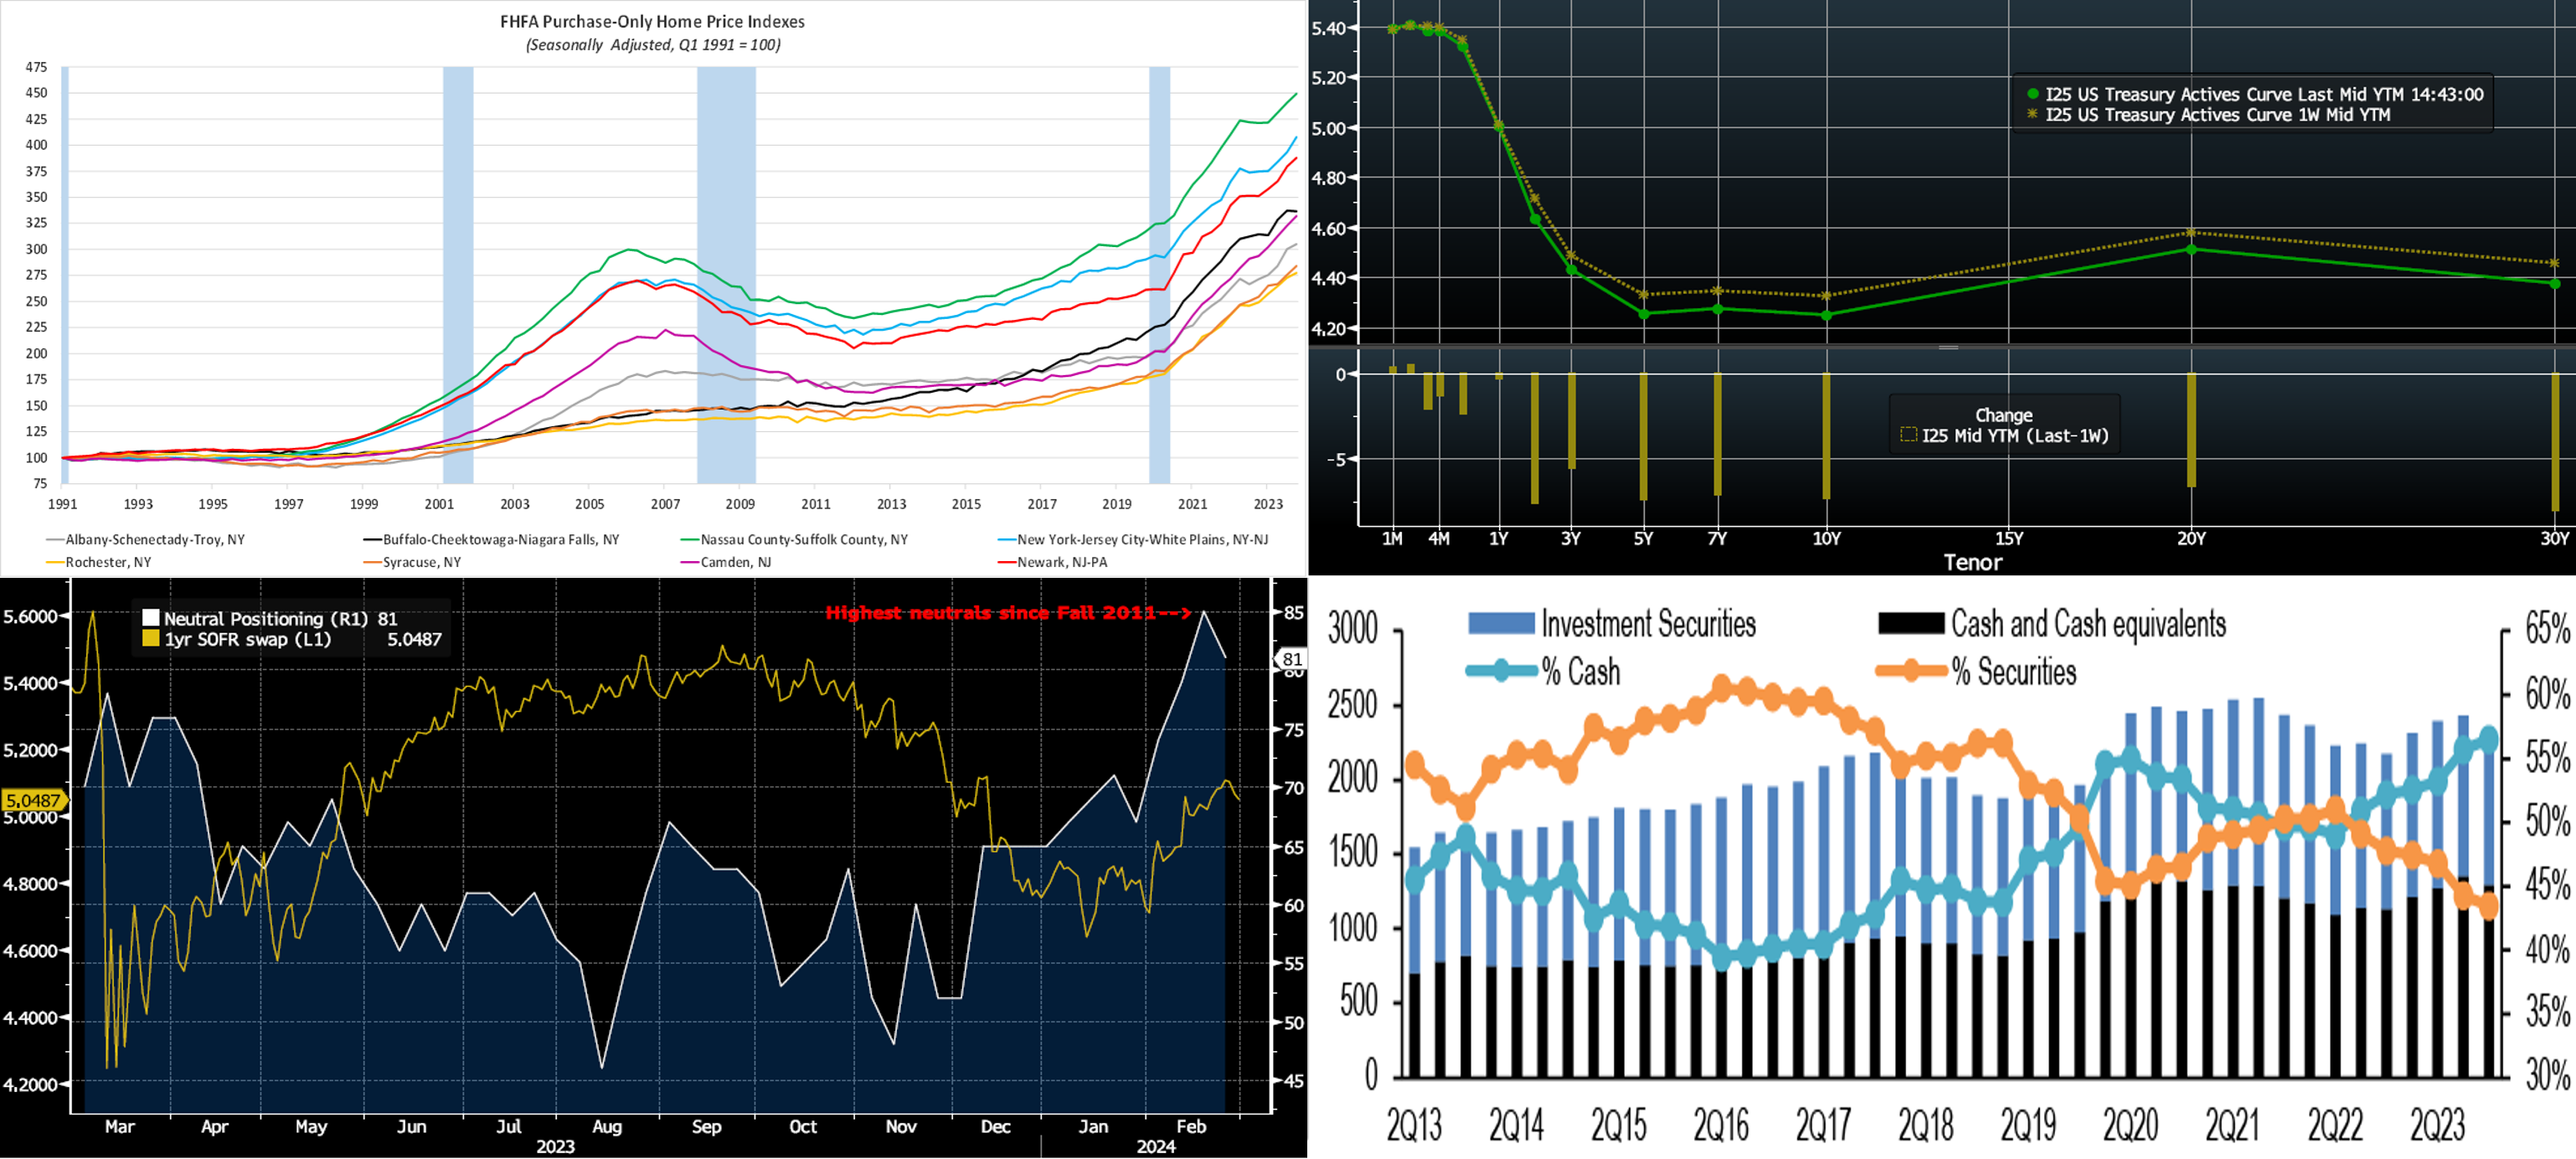
CHART 1 UPPER LEFT
Source: FHFA; FHLB-NY. Note: Blue shaded areas denote recessions. Home selling prices continued to climb across virtually all major metropolitan areas within the FHLB-NY district during the final quarter of 2023. The average price increase witnessed over the October-December span was 2.1%, down from 3.3% over the summer. Over the course of last year, home prices rose by 10.2% on average, following an 8.8% gain in 2022. Enjoying a hefty 13% jump, the Camden, NJ area recorded the largest increase in home-selling prices in 2023. At a comparatively modest 6.7%, Nassau and Suffolk counties posted the smallest. Over the past three years, canvassed areas within the FHLB-NY coverage area have seen home prices rise at an annual rate of 10.8% on average. Likely helping to support prices has been the multi-decade low levels of existing home inventories in recent years, although inventories have risen off the lowest levels of roughly two years ago. Also, note that mortgage rates fell markedly in Q4 2023 from a high of ~7.90% in mid-October to ~6.75% in late-December.
CHART 2 UPPER RIGHT
Source: Bloomberg. Top pane is yield (LHS, %), bottom pane is change (LHS, bps). From last Thursday afternoon to this one, the UST curve declined by ~5 to 7 bps, led by the 5- to 10-year sector. Data and Fedspeak during the week were generally of unsurprising nature, and rates consolidated a bit lower from the rise of recent weeks. In terms of market-implied pricing of the Fed, a full 100% probability of a 25 bp cut is now August 1st, with June 13th FOMC priced at ~73% chance of a cut. The year-end 2024 forward is ~4.515%, roughly the same as last week. Therefore, the market prices for a cumulative total of ~81.5 bps of cuts by the end of 2024, also about the same as a week ago. Perhaps best illuminating the change in markets over the past month is that market pricing for end-2024 is now only ~11 bps below the latest Fed’s “dot plot” projection of 4.625%!
CHART 3 LOWER LEFT
Source: Bloomberg; JP Morgan. Shown here is the “JPM Treasury Investor Survey Sentiment All Client Neutral” positioning index (White, RHS, %) which, in the low-to-mid 80’s zone the past two weeks, has reached the highest levels since 2011. Essentially, this barometer measures investor positioning outright vs. benchmark indices. Positioning has clearly moved to neutral over the past month, in tandem with the market’s repricing upwards of Fed policy, as portrayed here in the upward move of the 1-year SOFR swap rate (Gold, LHS, %) in the past six weeks. At this stage, with positioning more neutral, a surprise data release can potentially spur a notable market move in rates in either direction.
CHART 4 LOWER RIGHT
Source: Bloomberg; JP Morgan. Shown here are investment securities and cash/cash equivalents held by S&P 500’s non-financial companies, both absolute (LHS, $bn) and as a % of aggregate cash portfolios (RHS). Cash investment portfolios of S&P 500 corporates grew by $125bn to $2.3trn over 2023, with cash & cash equivalent allocation at a historical high of 57% at year-end. Corporates increased their balances in Money Market Funds (MMFs) over the year, surely contributing to MMF AUM reaching record levels this year and helping demand for short-end paper.
FHLBNY Advance Rates Observations
Front-End Rates
- Short-end rates were generally 1- to 2 bps higher week-over-week. The market continued to price lower odds of a near-term Fed cut, and this dynamic prompted the slight move higher. Net T-bill supply, after a long spell in positive territory, is now expected to decrease and eventually turn negative next month. This development, all else equal, may help tighten spreads on FHLB paper. Moreover, short-end supply continues to be absorbed as well.
- Money Market Funds (MMFs) currently stand at or near all-time high AUM levels.
The market will monitor data, especially Friday’s jobs report, and Fed speakers this upcoming week.
Term Rates
- The longer-term curve, generally mirroring moves in USTs and swaps, moved 5 to 8 bps lower week-on-week, led by the 5- to 10-year zone. Please refer to the previous section for color.
- On the UST term supply front, the upcoming week serves a reprieve from auctions. Corporate bond supply, however, has been heady and may remain so. Note that UST auctions usually occur at 1pm and can occasionally cause volatility around that time. Please contact the Member Services Desk for further information on market dynamics, rate levels, or products.
Grant funding under the FHLBNY 2023 Small Business Recovery Grant (SBRG) Program has begun and some funds are still available. The SBRG Program provides grant funds to benefit FHLB-NY members’ small business and non-profit customers. Please visit the SBRG webpage.
Price Incentives for Advances Executed Before Noon: In effect as of Tuesday, September 5, 2023, the FHLBNY is pleased to now offer price incentives for advances executed before Noon each business day. These pricing incentives offer an opportunity to provide economic value to our members, while improving cash and liquidity management for the FHLBNY. For further details, kindly refer to the Bulletin.
The Symmetrical Prepayment Advance Feature
For those anticipating term funding needs, and with rates on an uptrend, it can be an appropriate juncture to consider our SPA feature. This feature allows the member to capture, at prepayment, changes in the fair value of the advance which are favorable to the member. Contact Member Services Desk to discuss.
Looking for more information on the above topics? We’d love to speak with you!
Questions?
If you wish to receive the MSD Weekly Market Update in .pdf format (includes FHLBNY rate charts) or to discuss this content further, please email the MSD Team.